Recording animated drawings/movies of open-eye visual hallucinations
Recreation of a visual hallucination
Short summary
We have recorded 9 hours of geometric visual hallucinations with a custom-made computer program and a Wacom pen & tablet. You can freely download our recording and source code. Our long-term goal is to analyze this data, and write a program that simulates the hallucinating brain well enough to recreate such visuals. This website chronicles our efforts.
Everything is distributed under the MIT license, which basically means you're free to do whatever you want with it without asking. Still, if you do something interesting with our data, we'd love to hear from you. You can contact us at info@hallucination-research.com
Spontaneous pattern formation in primary visual cortex -
Paul C. Bressloff and Jack D. Cowan
What Geometric Visual Hallucinations Tell Us about the Visual Cortex -
Paul C. Bressloff, Jack D. Cowan, Martin Golubitsky, Peter J. Thomas and Matthew C. Wiener
Geometric visual hallucinations, Euclidean symmetry and the functional architecture of striate cortex -
Paul C. Bressloff, Jack D. Cowan, Martin Golubitsky, Peter J. Thomas and Matthew C. Wiener
If you find these academic research papers too mathematical and hard to read, we recommend Mr Cowan's video lectures which are easier to digest for a layperson:
In short, we do not add any new mathematical analysis. We contribute experimental data in a form which, to our knowledge, has not existed before.
All previous work seems to be based on still images that were drawn on paper by people hallucinating. But open-eye visual hallucinations ("OEVs" from here on) are not still images, they change over time. Wouldn't it be interesting to somehow see a glimpse of the motion, the dynamics, that hallucinators experience?
Also, hallucinators often report that the classic form constants appear most clearly with closed eyes or when looking at a single-colored background. When looking at real objects in the room, or shapes on paper, the OEVs are affected and differ from the form constants. Previous work does not seem to have investigated this input-sensitivity much.
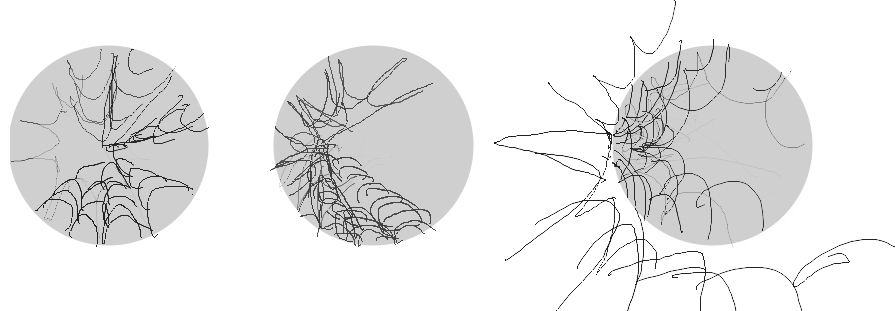
Three different hallucinations; one drawn when staring at the center of a circle, the second drawn when staring between the center and the left edge, and the third drawn when staring at the left edge. A short piece of our recording, giving a glimpse of how OEVs change over time.
How we gathered data
The goal is to show various geometric shapes to a test subject under controlled conditions, and let the subject draw his OEVs in real time. To record such data, pen and paper is insufficient. Imagine if we give the subject a paper with a simple geometric shape, a test image, and tell him to look at it and draw his OEVs. The subject will see what he has drawn, which will in turn influence his OEVs and destroy the simple controlled environment. Also, the pen and the subject's own hand will constantly influence his OEVs as he is moving it around.
It's better to draw on a computer screen than on a piece of paper. The pen and hand will be hidden. The subject only needs to see a mouse cursor, which can be made very small and subtle in order to influence the experiment as little as possible.
But computer mice are not very nice to draw pictures with. We bought a professional tablet (Wacom Intuos Large) and thought about how to use it for this experiment. Obviously we don't want to store an image, we want to store a movie. Basically a list of positions in space and time, telling us where the pen was located and when. Also, the computer monitor need only show the test image, it should not show the lines that the user has drawn. It will work a bit like drawing with invisible ink. The lines will be invisible when drawn, but stored on disk and can be viewed later.
Hallucinators often report a phenomenon called "tracers", where moving objects, for example a ball thrown in an arch seems to get a tail of visual patterns. What seems to matter is when objects move relative to the visual field, which means that when a hallucinator turns his head or even just his eyes, shifting his gaze, he will experience the tracers phenomenon across the whole visual field. This will affect our experiment! Even if we show a static simple geometrical shape to the test subject, he may move his eyes. This means we need eye tracking! We obtained a web camera and open source eye tracking software, but sadly it was too inaccurate/unreliable to be of use.
We settled for the less advanced solution of marking a spot in the middle of each test image and telling the test subject to try to fixate his gaze on that point, and not let his gaze wander around the image. Of course we have no quantifiable measure of how well this instruction was actually followed. It's near impossible to keep one's gaze completely fixed on one point for very long. Small eye movements (saccades) are said to be a natural and important part of vision. But our hope is that small movements will not significantly affect our analysis.
The data was recorded in two separate sessions, on 2013-11-30 and 2014-04-26, each session lasting roughly 4.5 hours. For simplicity, we have pasted both sessions into one single file. But we still have the raw data available, if anyone should want it.
Physical measurements
The test subject was seated at a typical office desk, with the eyes around 50-60 cm from the center of the computer monitor. His head was not fixed at a certain distance from the screen, he was free to move around during the experiment, but asked to try to stay still.
The computer monitor had a resolution of 1280 * 1024 and a physical image size of approx 37,7 cm * 30,2 cm, thus it's not a modern widescreen. The Wacom Intuos Large active drawing area is approx 33cm * 20cm, thus it's widescreen while our monitor is not, so we went into the wacom driver settings and activated the setting "force proportions", which shrunk the active drawing area to approx 25cm * 20cm, leaving the rightmost part of the tablet unused. We covered the unused area with thin plastic, so the subject could physically feel where the new edge goes.
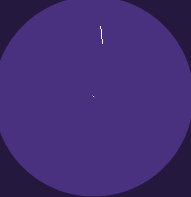
Note that the small black&white spot in the center is where the subject is asked to stare, the "fixation point".
Why did we choose these particular geometric shapes? Honestly, through guesswork and intuition. This work is in the early, exploratory, stages, so there's not much to go on. Basically a "this looks interesting, let's see what happens" approach. Later, maybe there will be predictions from theory, and then we could design images to test a specific prediction in a more systematic manner. Still, some thought went into the current image selection. The idea is to vary one variable at a time and keep everything else constant.
The same shape at different sizes (circles with 4 different radii)
The same shape at different positions
The same shape rotated at 0, 45 and 90 degrees
Corners where two lines meet at various angles, all the way from 22.5 to 157.5 degrees
Why did we choose the dark blue/purple colors for the test image? For two reasons.
1. We don't want to send too much brightness into the subject's eyes. Bright lights cause an afterimage effect. But here we are interested in visual hallucinations, not normal afterimages, so we need dark images with quite low contrast.
2. The image on a computer screen is made out of small red, green and blue sub-pixels. This blue/purple color is the most smooth color possible on our screen - i.e the red, green and blue sub-pixels all shine with roughly the same brightness. A pure red color, on the other hand, has a slight "grain" as only 1 out of every 3 sub-pixels are lit. We don't know whether the subject's hallucinations would have been affected by such a grain, but it didn't hurt to prevent that risk.
Results, so far (Last updated 2021-01-20.)
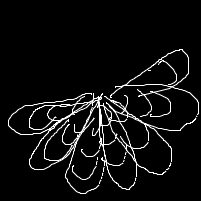
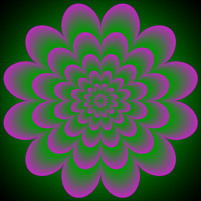
The test subject is not a trained artist, not used to drawing shapes quickly and accurately. He reports that his OEVs move and change very quickly, leaving little time to carefully record them in full detail. Although the OEVs covers his whole visual field, he only has time to draw a miniscule fraction of them near the center of the visual field. He also reports that his OEVs are mathematically "perfect", while the drawn lines are wobbly and imprecise. In other words, when you see that the test subject has drawn something like this:
you can try to imagine that his subjective experience was more akin to this:
Therefore, our test subject was later asked to watch the recording of the lines that he drew, and to try to remember what each discrete pattern was supposed to look like, and to redraw this pattern more carefully, in more detail. The list below contains some of these drawings, called "reconstructions".
Click "heat map" to see ALL lines that were drawn onto a specific test image. We don't believe this is a great method for analysis, but it's better than nothing while we try to invent better ways.
Transitions
Our test subject was also asked to look for any other characteristic phenomena that he didn't manage to capture in the drawings. He has mentioned these:
Transition when focusing on a new spot
All of the form constants have one thing in common: they have rotational symmetry around a center point, for example like a cobweb. But what happens when the hallucinating person shifts his gaze to focus on a new point, some distance away from the old center point?
Our test subject didn't finish this animation, but the idea is clear anyway. The form constant does not immediately shift to the new center point. Instead, the new center point will gradually "attract" spots from the surroundings, and the old center point will gradually lose its grip. He says that it takes at least 10 seconds for this transition to complete.
Transition when moving the eyes back and forth along a line, then stopping
The subject describes that, while moving the gaze back and forth along a straight line, the fundamental geometry of the OEVs tend to look like the first frame of this animation: patterns tend to be repeating equidistantly, and with "normal" lines oriented orthogonally to the main line, kind of like a ladder. Then, when he stops the eye motion and starts to stare at a fixed spot, those normal lines will gradually rotate outwards, becoming more and more like the classic form constant geometry.
Effect when quickly moving an object across the visual field
The moving object "offsets" the OEV patterns a short distance in the direction of motion. This offset region remains even after the object has passed, but the sharp corners gradually soften.
Effect when adding a new object into the visual field and leaving it there
Initially, the new object only affects the OEVs right outside its edges. The longer it stays, the farther away its influence spreads.
Mouse cursor tracers
In our custom drawing program, instead of the normal mouse cursor, we use a small white dot with soft edges. Our test subject describes that, while this dot is moving around quickly, it leaves discrete, distinct copies of itself. These copies then flicker on/off at a high frequency, and gradually fade away.
What we're trying to do next
Gather more data
Gather more data with a refined version of the program. Use a larger number of test images, with small variations between each. For example, test for rotational invariance by showing rotated versions of the test images, at least 8 different angles. Try inverted colors for the test images and background, to see if light/dark makes a difference. Try with completely different colors (red, green) although our subject predicts it won't make a difference. Try with one eye closed, then the other eye closed. Store pen coordinates in floating-point format instead of integer. Find and buy the most accurate eye tracking device that exists. Use a chin rest so the test subject's head will stay in a fixed position.
Clean up the recorded data
Figure out how to clean up the recorded data. Cleanup will probably be done with a combination of automatic algorithms and manual guidance, relying on the test subject's recollection of how the drawing was supposed to look.
Share, share, share
Make it easier for other people to use our code and data. Make the code compatible with screen sizes, all major platforms and popular graphics libraries. Clean up the code, write better documentation, and enable comments on this website.
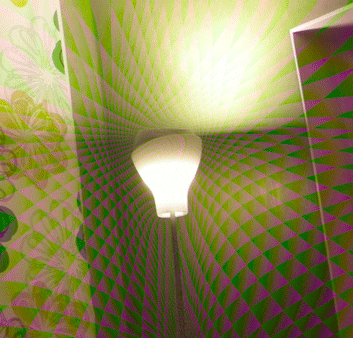
OEVs don't actually look like wobbly line drawings, so make some short animations that try to illustrate how OEVs actually look. The one to the right is the best we have so far. It's not generated from the gathered data, it's drawn by the subject in another custom animation program and overlaid on top of a photo. But this is just a short loop. Make a longer version with more complex motion! The "lines" should bend and move. For some other people's replications, look at PsychonautWiki's gallery
Stand on the shoulders of giants
Study the above papers in depth. Try to recreate their analytical mathematical model as a numerical simulation, and feed it input from virtual eyes. We'll probably need to incorporate neuron models and reaction-diffusion simulations (for example FitzHugh-Nagumo), mixed with convolutional neural network architecture (for example Google's DeepDream). Adjust the program until its output hopefully becomes similar to our raw data recorded from test subjects.